How does Zenobē measure carbon impact?

Our mission is to make clean power accessible. To ensure more clean, renewable power in electricity grids and more zero-emissions vehicles transporting people and goods. As an inherently sustainable business, we’re committed to transparency and accuracy in measuring and communicating our carbon impact. That’s why you’re reading this article.
Measuring the carbon impact of our operations is central to understanding our role in mitigating climate change. By quantifying the carbon avoided from our EV and large-scale batteries, we can foster greater accountability and transparency in our sustainability practices and demonstrate the benefits of transitioning to clean power and transport.
01.
How do we measure our carbon impact?
We track and measure our carbon impact in two ways. One, as carbon footprint, which you can find more detail about in our sustainability report and two, as carbon avoided.
To measure carbon avoided, we developed a robust methodology and tool, designed to calculate the carbon avoided through our fleet of electric vehicles (EVs), and grid-scale battery storage solutions.
Read more about our sustainability strategy and reporting here.
02.
What is the intent of the carbon avoided tool?
The tool was designed to:
- Accurately calculate carbon avoided from Zenobē’s EV fleets, stationary battery storage portfolio and ancillary services (services we provide to the electricity grid).
- Enable data-driven insights into our environmental performance.
- Provide our stakeholders with third-party verified and reliable information on the environmental benefits of our operations.
03.
Why has this tool been externally verified?
Although we have collected substantial data to calculate CO₂ savings to date, the methodology and underlying calculations needed to be independently reviewed as part of our commitment to transparency, accuracy and continuous improvement. External verification ensures that our data and processes are robust, accurate, and aligned with applicable standards, such as ISO 14067.
04.
Who verified the tool?
We engaged DNV, a leading independent assurance provider, to:
- Conduct a gap analysis of our methodology and calculations.
- Compare our practices against ISO standards, industry best practices and the best available data sources.
- Recommend updates to enhance accuracy, transparency, and usability.
- Improve the functionality.
05.
What is the outcome?
DNV’s review confirmed the soundness of our methodology while identifying areas for improvement. We implemented these recommendations, including adding time and location specific carbon intensity data, building out scope 3 emissions and developing user-friendly dashboards. Following this, DNV verified the accuracy and appropriateness of our calculations.
Verification ensures:
- Alignment with ISO standards and GHG accounting.
- Robustness of data sources and calculation methods.
- Confidence in reporting net CO₂ savings.
To maintain this third-party verification, we have committed to documenting all updates, ensuring references are accurate, and confirming that changes do not alter the calculation methodology without further review by DNV.
06.
Electric fleets methodology
Benchmark: hybrid-diesel bus
- Annual CO2 savings:
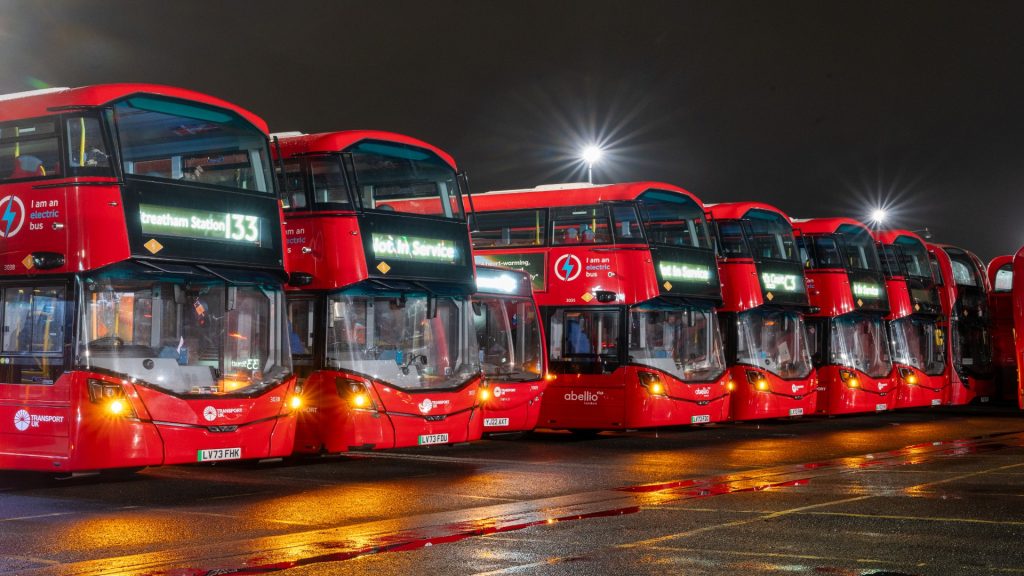
- Using the average distance travelled by a bus per year and the fuel efficiency of a hybrid-diesel engine, we can calculate the annual diesel consumption of a hybrid-diesel bus.
- We can then use the CO2 emitted per litre of diesel to calculate the CO2 emissions that would be emitted by diesel buses travelling this distance in a year. These are the emissions that are saved by substituting a hybrid-diesel bus by an electric bus.
- These savings can then be scaled to the size of our electric bus fleet to give the annual savings of our whole fleet.
- Annual CO2 emissions:
- We do take energy off the grid to charge the batteries of our buses, and this has an associated carbon output that reflects the energy mix of the grid.
- Using the average distance travelled by a bus per year and the average electrical efficiency of an electric bus (kWh consumed per km travelled), we can calculate the average electricity consumption per bus per year.
- Using the carbon intensity of the grid along with future emissions for electricity carbon intensity is based on these projections we can calculate the CO2 output associated with this energy requirement.
- This CO2 output can then be scaled to the size of our bus fleet.
- Annual net CO2 savings: Our annual CO2 savings from not consuming fuel, (1), less our annual CO2 emissions from charging our buses off the grid, (2), is equal to our annual net CO2 savings of our EV bus fleet (3).
- CO2 coefficient/litre (kgCO2/litre) https://www.gov.uk/government/publications/greenhouse-gas-reporting-conversion-factors-2023
- C02 coefficient/litre – well to tank (kgCO2/litre) – https://www.gov.uk/government/publications/greenhouse-gas-reporting-conversion-factors-2023
Bus Battery:
- CO2 intensity (gCO2/kWh) – https://carbonintensity.org.uk/
Fuel Savings:
- Average fuel efficiency (miles/gallon) – new hybrid TfL buses – https://www.london.gov.uk/who-we-are/what-london-assembly-does/questions-mayor/find-an-answer/tfl-hybrid-bus-fleet-fuel-economy

07.
Network infrastructure methodology
CO2 savings are benchmarked against the provision of power and/or stability services versus a gas peaking plant (540gCO2e/kWh) or CCGT (450g CO2 e/kWh, operating at Stable Export Limit for provision of stability), depending on the time of operation. Carbon intensity of imported energy to charge the battery is assumed at the 2024 national average of 150g CO2 e/kWh, which is a conservative assumption considering the high penetration of renewable generation and otherwise curtailed power in Scotland when the battery would charge.
Benchmarks
- CO2 savings are benchmarked against the following assumptions when exporting energy into the battery
- Gas peak plant (540gCO2e/kWh) – based on UK Government emission factors for gas and assumed efficiency of 38%
- CCGT plant (450gCO2e/kWh) – based on UK Government emission factors for gas and assumed efficiency of 55%
- CO2 savings are benchmarked against the following assumptions when importing energy into the battery
- Average GB grid intensity in 2023 of 150g/CO2e/KWh
Sources

08.
Equivalents methodology
Homes conversion
The number of homes the site can power is calculated by first calculating the daily discharge output of the battery in MWh, multiplying this by two cycles per day and by the state of health (taking into account degradation). Then, based on the Ofgem typical household consumption of 2,700 kWh of electricity a year, the average hourly household consumption of 0.31KWh is calculated. The daily discharge output of the battery, divided by the hourly average household consumption generates the number of households powered based on the battery’s daily cycling discharge.
Sources
- https://www.ofgem.gov.uk/average-gas-and-electricity-usage
Cars off road conversion
The typical UK diesel car emissions are 0.27kg/CO2e per mile and the average miles driven per car is 8,300 miles per annum. The total tonnes of CO2e saved is divided by this per mile figure, divided by the average annual mileage and then divided by 15 years.
Sources
