Commercial fleet owners are facing a challenging few years, not least for investment planning. The mandate to move to zero emissions comes with a fundamental shift in the makeup of a truck’s total cost of ownership (TCO).
Evaluating TCO provides a mechanism to compare various fuel types and determine the best longer-term solution for fleet fuelling. Battery electric solutions are already the predominant technology for zero emission fleets and operators need to be able to evaluate the true cost of operating such vehicles. Here we will explain some of the key principles.
As well as our guide to electric vehicle batteries and battery performance for fleet operators, below we provide a back-to-basics summary on the role of electricity within TCO.
Transitioning from a diesel fleet to a battery electric one is a challenge, but there are ways and means of smoothing the transition to make it more cost effective, and reap the many benefits from operating electric vehicles.
One of these is by considering the total cost of ownership (TCO) of the fleet. TCO is a key metric for fleet operators that is used to understand the lifetime costs of different vehicle types and financing structures.
The key components of TCO for an electric commercial HGV fleet include the cost of the vehicles, the batteries, the depot-based charging infrastructure, electricity costs and maintenance. Yet TCO is changeable depending on external cost factors; being aware of the ‘sweet spot’ of parity can help fleet owners make decisions.
Note, this TCO analysis does not include the one-off cost of the grid connection due to the variation in costs. Grid connection costs are set by the local Distribution Network Operator (DNO) and vary based on a number of factors.
While battery electric commercial vehicles have an increased capital cost compared to their diesel predecessors, their TCO can be lowered and therefore made more competitive thanks to lower fuel and maintenance costs. We’ve been partnering with bus operators across the UK since 2017 to determine the most cost-effective methods for charging their vehicles to drive down costs and levelling out the initial higher up for cost for the asset with lower fuel costs.
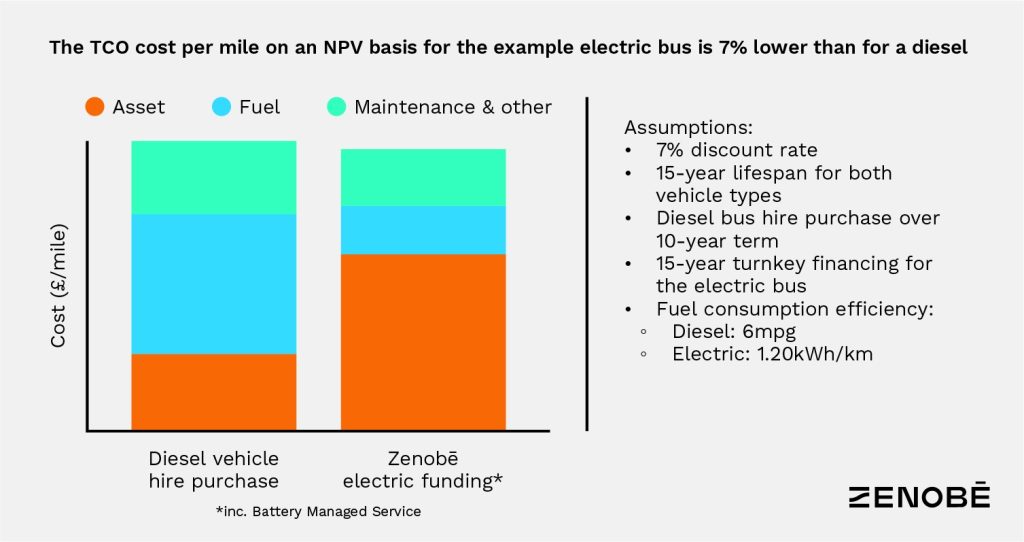
The figure above demonstrates for an electric bus, how on a cost per mile basis, parity can be reached and significantly exceeded. However, this is not achieved by simply replacing a diesel vehicle with an electric one. One of the key elements is fuel (electricity) consumption efficiency, controlled by smart charging software and intelligent fleet management.
How does this apply to the HGV industry, which differs from passenger transport in several fundamental ways?
TCO analysis for the HGV industry requires a different set of inputs than those for the bus industry, notably the duty cycles performed in the sector, among others. Yet, as analysis from Element Energy suggests, parity between diesel and electric is possible.
When assessing future costs, HGV fleet owners will need to consider possible future prices of electric; to enhance this further, we advise they consider optimisation of their operations to adapt to battery electric vehicles. One of these enhancements is smart charging.
Smart charging involves strategically charging vehicles to minimise electricity bills, while ensuring each vehicle is powered sufficiently to complete the duty cycle it is assigned to do, i.e. if depot based, the urban territory it has to cover or the assigned delivery route.
Optimising when an electric vehicle fleet is charged has a major impact on operational costs. Depending on your electricity tariff, the price of electricity can change twice a day and this is known as a dual tariff. However variable tariffs are also available and have a different price every half hour or hour.
This variable pricing model combined with smart charging presents fleet operators with a valuable opportunity to shift charging to cheaper periods and make significant savings on the costs associated with recharging depot-based vehicles, especially where overnight charging is the predominant solution.
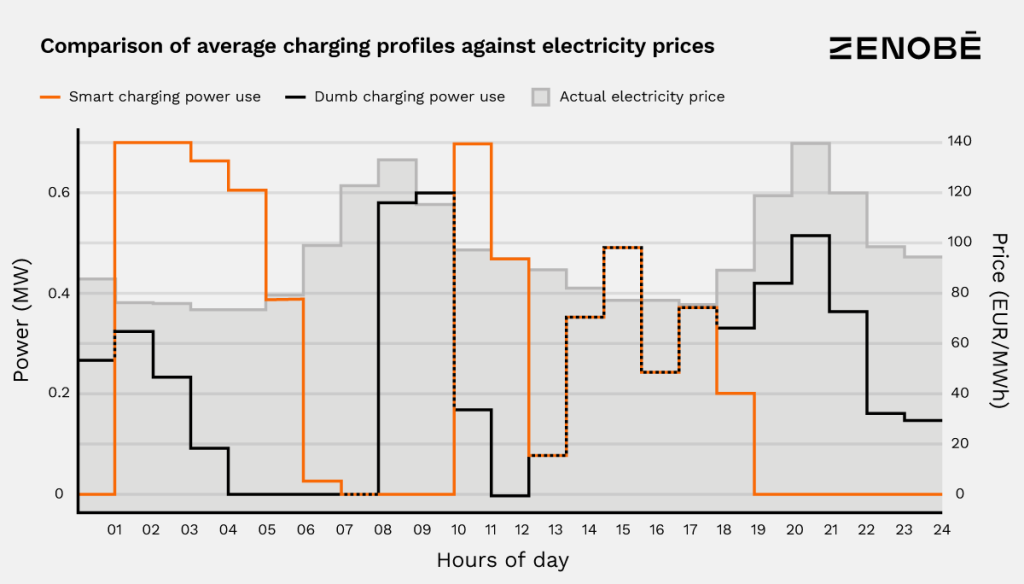
Dumb charging simply provides an electric charge when connected to a vehicle without any intelligent or responsive controls.
The figure below compares the charging profile of a dumb charger and a smart charger in relation to the electricity prices of the day. This example is based on a typical depot of large commercial vehicles, in this case a large bus garage with 15 vehicles.
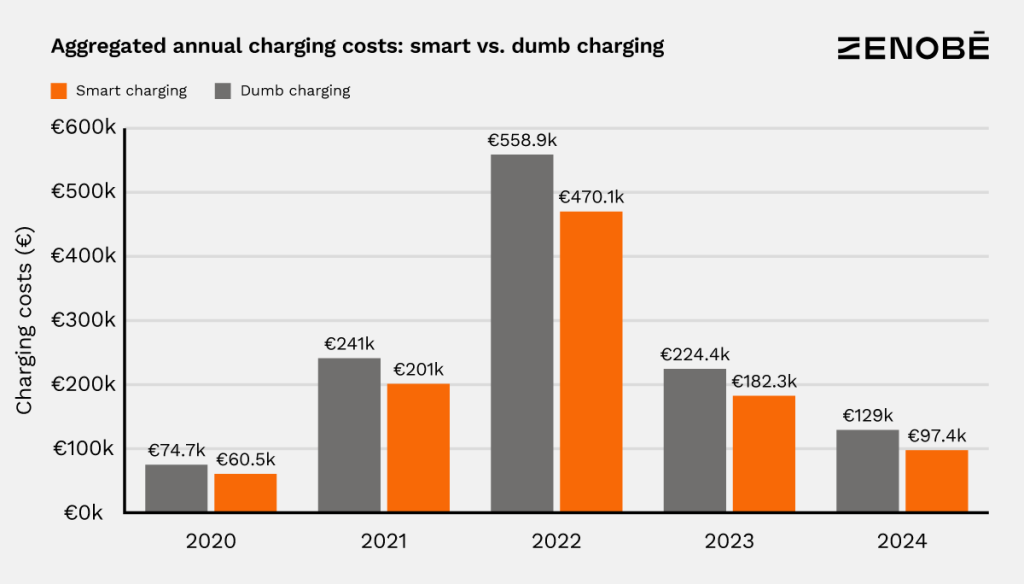
Our EV analytics team modelled the savings from Zenobē’s smart charging strategy over four years from 2020 to 2024 and on average it delivered a 17.8% saving to operators who integrated the technology into their charging infrastructure.
It is important to note that even during the high electricity market volatility of 2022 our approach to smart charging still achieved an average saving of 15.9% on electricity bills.
In the chart below, we can see how savings created by smart charging could be reflected in annual costs.
Smart charging is integral to any fleet electrification strategy and its ability to produce significant savings can have a significant impact on driving down your TCO.
The charts in Figure 2 and Figure 3 depict a simulation. Modelling was carried out using parameters and data from a Belgian site. This included the half-hour price variation that is used in Belgium. Please note that price parameters vary from region to region, which affects such analysis.
Expand your fleet transition toolbox and read our whitepaper ‘Smart fleet electrification starts with battery management’ a guide to achieving the best outcomes from the batteries on board your new fleet of electric vehicles.
This isn’t the future, it’s happening now. Our team of engineers and finance experts are here to help you on your journey. Fill out the form, and we’ll be in touch.
Thanks for getting in touch – we’ll respond as soon as possible. You can also reach us on contact@zenobe.com

Pete leads Zenobē’s growing team of Product specialists across all areas of the business. His team oversee our R&D as well as product development in both hardware and software.
He has been working in the European E-Mobility sector from over ten years, specialising in the design, build and delivery of software systems for EV Charging.